Portfolio Size, Return, and Risk: almost stochastic dominance
Project portfolio management answers the question, "Given our choices, how should we invest? The concept of almost stochastic dominance suggests addressing the phrase, "given our choices." Specifically, if (a) a new investment's expected value exceeds a threshold, which is usually somewhat low, and (b) the projects' results are uncorrelated (or poorly correlated), adding the asset to the portfolio produces a superior combination of risk and return. Similarly, the portfolio is superior to all the portfolios it contains.
Let's see how this result occurs. Start with a single project. Figure 1 illustrates a probability distribution of its results.
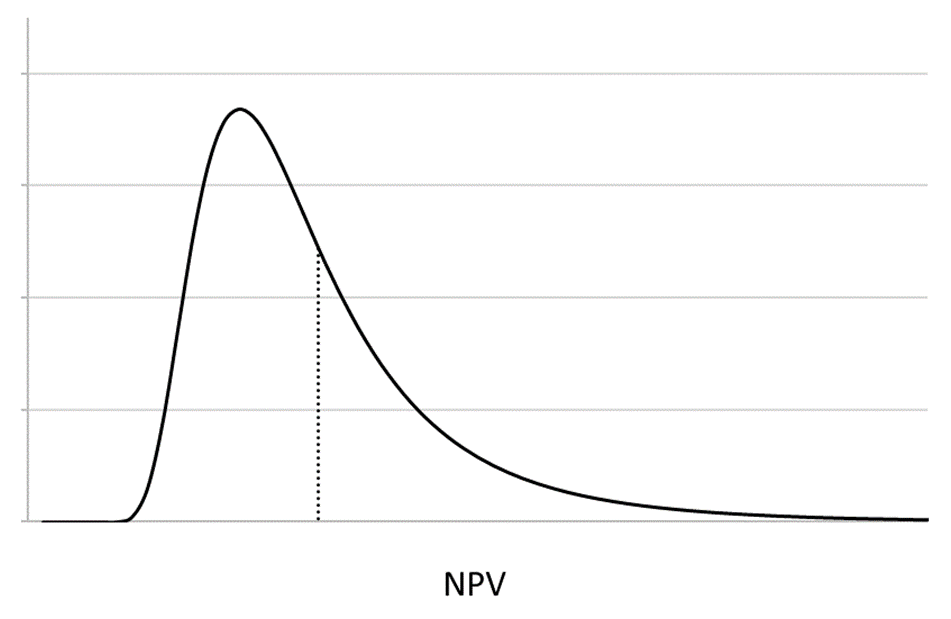
Figure 1: A probability distribution of the profits a project may produce.
If you estimate a distribution of payoffs for all the projects available to you, you can then estimate the probability distribution of payoffs of any portfolio you may create. Figure 2 presents an example by illustrating the cumulative distribution functions (CDFs) of two portfolios. Look at the possibility of NPV = 2. The dotted curve has a 30% chance of producing NPV < 2 and a 70% chance of producing NPV > 2. Meanwhile, the solid curve has a 45% chance of producing NPV < 2 and only a 55% chance of producing NPV > 2. This relationship exists for every point on the horizontal axis. Compared to the portfolio producing the solid curve, the portfolio producing the dotted curve provides greater reward for portfolio risk. It is the preferred portfolio.
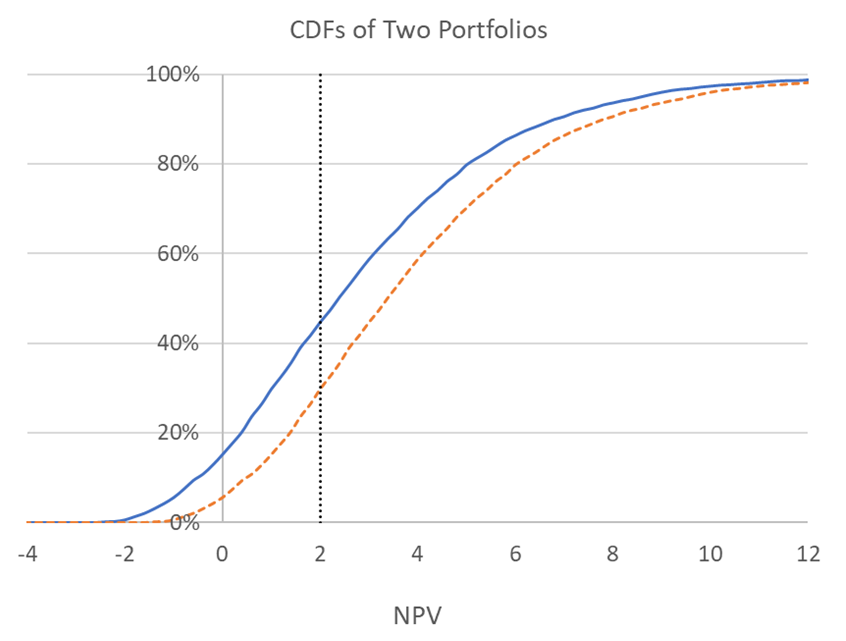
Figure 2: The CDFs for two portfolios. For every possible payoff, the portfolio producing the dotted curve has a higher probability of doing better and a lower probability of doing worse than the portfolio producing the solid curve. This relationship is called stochastic dominance.
Suppose you have a portfolio with fourteen projects and you consider adding a fifteenth project to it, where the fifteenth project satisfies conditions (a) and (b) above. Figure 3 presents the results. The larger portfolio stochastically dominates the smaller portfolio everywhere except for three percentiles at the extreme left, and for these percentiles, the curves are nearly identical (the dashed curve is slightly higher than the solid curve). This situation is called almost stochastic dominance. The larger portfolio is superior, and executives should prefer it to the smaller portfolio.
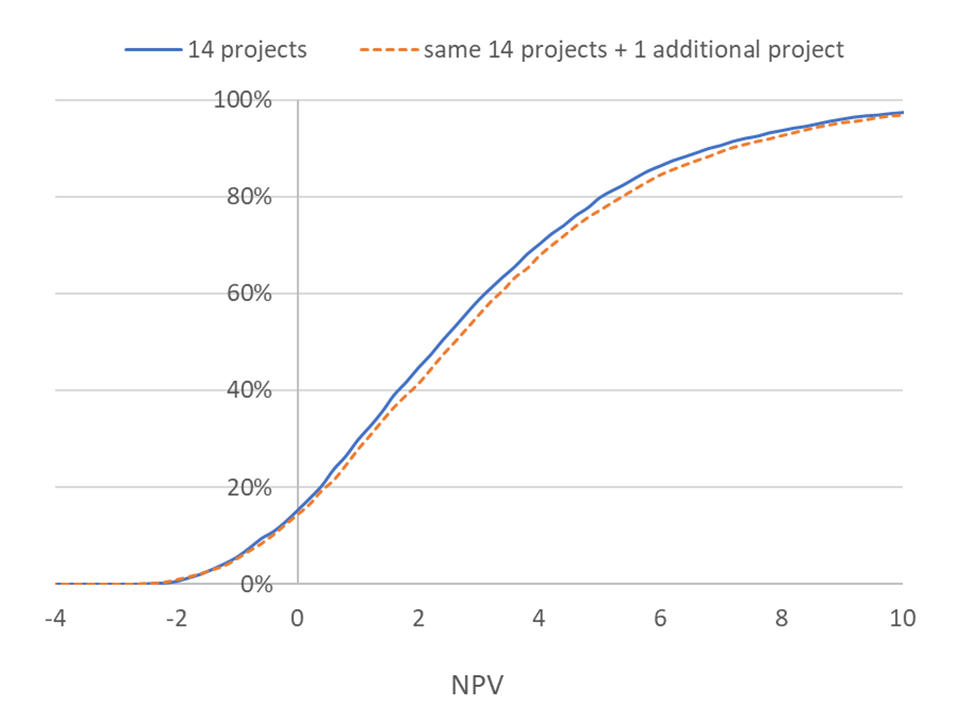
Figure 3: The CDF of a portfolio comprising fourteen projects and the CDF of a portfolio comprising the same fourteen projects plus an additional project. The larger portfolio almost stochastically dominates the smaller one.
To exploit this property, relax the "given our choices" assumption of portfolio optimization and test other portfolios to explore the risk and return implications of investing in more projects. You might test portfolios like the following ones:
- All available assets: Set a threshold of expected value, and test a strategy that invests in all your assets that meet the threshold, regardless of the budget and resource required. This portfolio illustrates the best return and risk qualities that your current choices can produce.
- All available assets with resource constraints: Now impose budget and resource constraints by allowing partial investment in some assets.
- Additional assets: Test having more choices. Using a statistical technique called bootstrapping, generate additional investments from your current set of possibilities and then repeat the above studies.
These tests require the correct probability distributions for projects' payoffs, and producing the correct distributions requires overcoming the optimizer's curse. (See my research project on the optimizer's curse.)
Test both portfolio and pipeline consequences: Drug development is not just a portfolio but a structured, phased process for efficiently resolving uncertainty. Test the above portfolios for different strategies of partnering, upstream or downstream, and observe the immediate and medium-term impact on your portfolio and pipeline. What skills, competencies, and resources does a strategy require? What strategies best leverage your existing competencies?
Test shots on goal strategies: Several articles in the drug development literature recommend having more, but smaller phase II trials. Given a budget constraint that limits the number of Phase 2 trials, funding more phase II compounds, taking more "shots on goal," is beneficial.
The articles assume phase II trials achieve the false-positive and false-negative rates they are sized to produce, but the error rates may be higher trial than forecasted by trial designs. (See my research project on clinical trial error rates.) With higher error rates, the shots-on-goal strategy is suspect. At least, you should test it with revised assumptions.
The simulations of almost stochastic dominance are compelling, but the concept requires mathematical proofs, which are part of this research project.
If you wish, kindly share your thoughts by using the form below, via phone (503.332.4095) or LinkedIn. Your concerns, thoughts, and ideas are the most important ones.